
Daniel Limberger, Carolin Fiedler, Sebastian Hahn, Matthias Trapp, and Jürgen Döllner
Proceedings of the International Conference on Information Visualization, 2016
Abstract • BibTeX • DOI • Paper
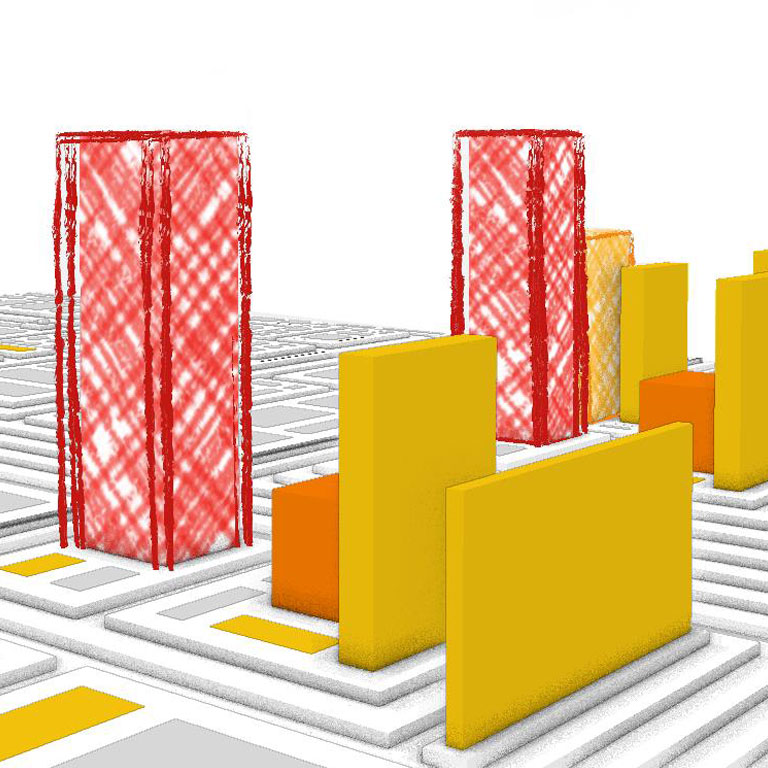
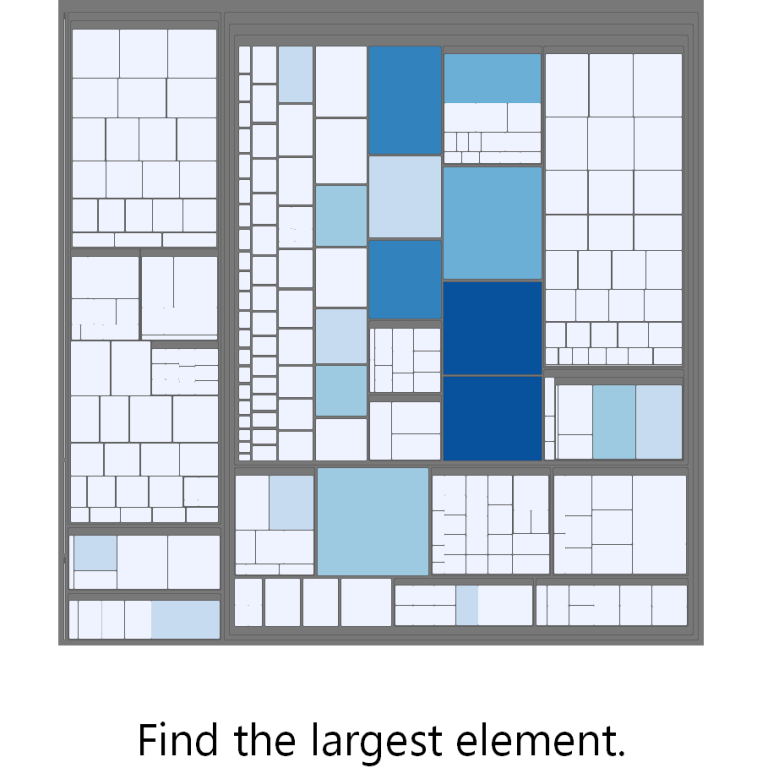
Treemaps serve as generic, effective tools to display, explore, and analyze multi-variate tree data in a scalable, interactive, and consistent way. In this paper, we discuss and evaluate sketchiness as visual variable of 2.5D treemaps. Sketchy rendering techniques allow us to map data, e.g., about uncertainty, imprecision, or vagueness, independently from mappings to other visual variables such as size, color, and height. To this end, we present a design space for sketchy rendering for 2.5D treemaps and corresponding implementation of a real-time sketchy rendering technique. The results of three user studies carried out indicate that sketchiness is a promising candidate for an independent visual variable for 2.5D treemaps, in particular to map ordinal data with a small range such as data that qualifies map items, it shows no strong interference with other visual variables such as color and height due to the regular gestalt of blocks and, hence, allows us to extend the expressiveness of 2.5D treemaps.
@inproceedings{lfhtd2016-sketchiness-treemaps,
 author = {Limberger, Daniel and Fiedler, Carolin and Hahn, Sebastian and Trapp, Matthias and D{\"{o}}llner, J{\"{u}}rgen},
 title = {Evaluation of Sketchiness as a Visual Variable for 2.5D Treemaps},
 booktitle = {Proceedings of the International Conference on Information Visualisation (IV)},
 year = {2016},
 pages = {183-189},
 doi = {10.1109/IV.2016.61},
 month = {July},
 organization = {IEEE},
}
Carolin Fiedler
Master’s Thesis in IT-Systems Engineering, 2018
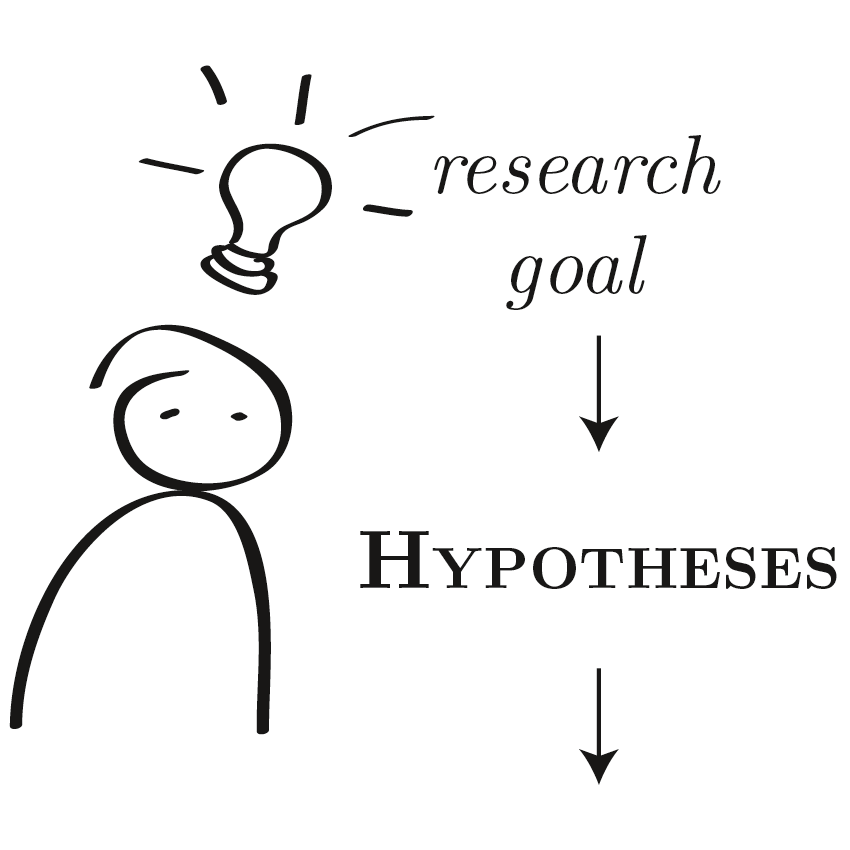
Information visualisation research focuses on the design and implementation of new visualisation tools and techniques. A necessary component of this research is the evaluation of a newly developed or adjusted visualisation technique. Inevitable issues are suitable application areas as well as strengths and weaknesses of the visualisation related to specific tasks and different kind of data. To identify causations researchers have to conduct controlled experiments that lead to generalised research statements. Unfortunately, design-based errors occur often. Errors which are based on the design of the study prevent researchers to derive a generalised statement or lead to erroneously accepted generalised statements. This thesis provides a framework that supports visualisation researchers in the preparation of informative and robust controlled experiments. The framework focuses on a design-centred approach to promote the most common cause of fault—the selection of independent variables. The development of the framework is based on an analysis of experiment-related literature and almost 60 previous experiments. Three derived theoretical models on controlled experiments lead to a software model which is realised in a preliminary implementation. Finally, the framework is evaluated utilising requirements identified during the analysis. Using the framework, a comprehensive configuration file format allows the declaration of complete experiments in one single file, which allows automated preparation and execution of the study. The implementation of a representative experiment accompanies the reader through each chapter, putting the respective results into practice.
Carolin Fiedler
Bachelor’s Thesis in IT-Systems Engineering, 2014
Abstract • Bachelor’s Thesis [de]
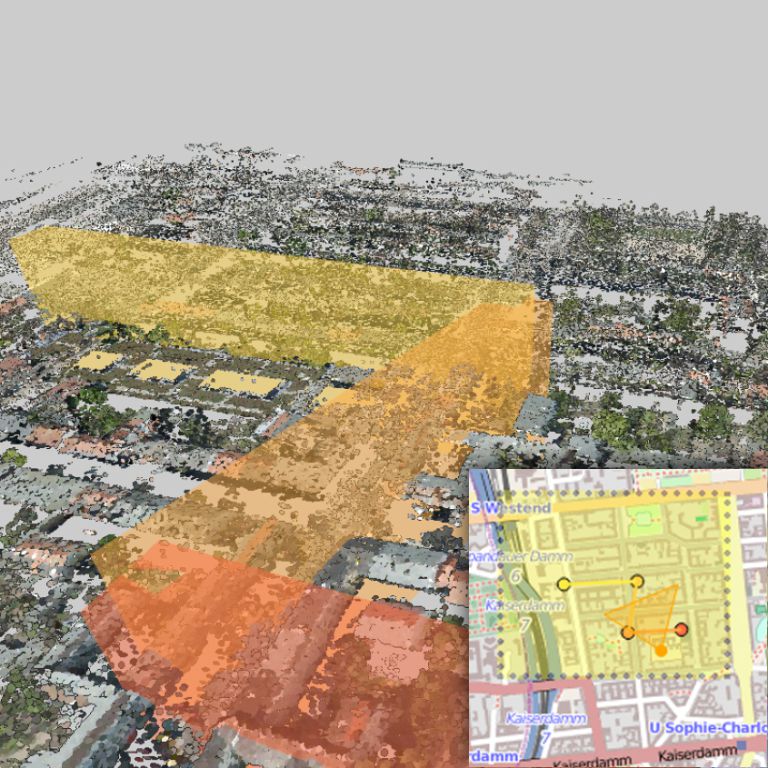
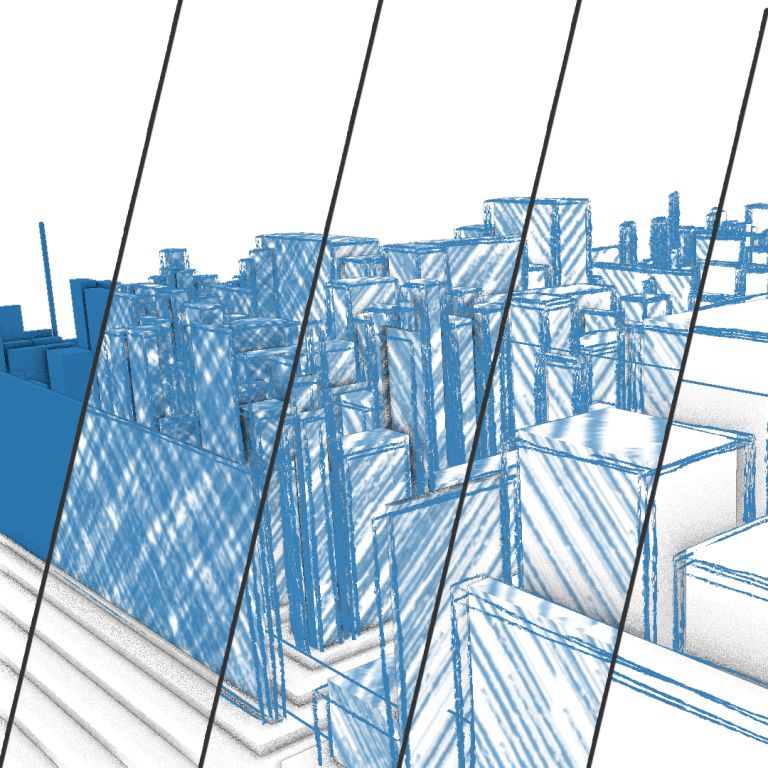
3D-Punktwolken sind riesige ungeordnete Punktdatenmengen, die aus terrestrischen oder luftgestützten Scans generiert werden. So entstehen diskrete Oberflächenstrukturen, die mit weiteren Attributen wie Farbe angereichert werden können. Die echtzeitfähige Visualisierung dieser massiven Daten benötigt Out-of-Core-Verfahren und geeignete Renderingtechniken. Neben der interaktiven Visualisierung und Exploration von 3D-Punktwolken in einer Szene können andere Visualisierungstechniken die Arbeit mit 3D-Punktwolken erleichtern. Diese Arbeit stellt hierfür zwei Visualisierungstechniken für die Analyse und Interpretation der Daten vor: Bei der Betrachtung von Stadtgebieten oder ganzen Städten kann der Nutzer schnell die Übersicht verlieren. Für die verbesserte Orientierung wird die Integration einer Minimap in eine bestehende Visualisierungskomponente für 3D-Punktwolken mithilfe von OpenStreetMap vorgestellt. Für eine exakte Interpretation kann es jedoch nützlich sein, Bereiche der 3DPunktwolke in weiteren Ansichten als innerhalb einer gerenderten Szene zu visualisieren. Die hierfür entwickelte Technik ist die Erstellung von Profilansichten durch Querschnittsbildung. Der Nutzer erhält die Möglichkeit, mehrere Schnitte festzulegen, die anschließend in einer einheitlichen Darstellung visualisiert werden. Durch die Reduktion der Verdeckung kann der bestehende Platz besser für die Visualisierung relevanter Daten genutzt werden.
A framework which enables its users to create, prepare and conduct controlled experiments for visualisation software based on a single JSON file.
Examination of suitable techniques and exemplary implementation of sketchiness—including multiple intensity levels—for three-dimensional geometry.
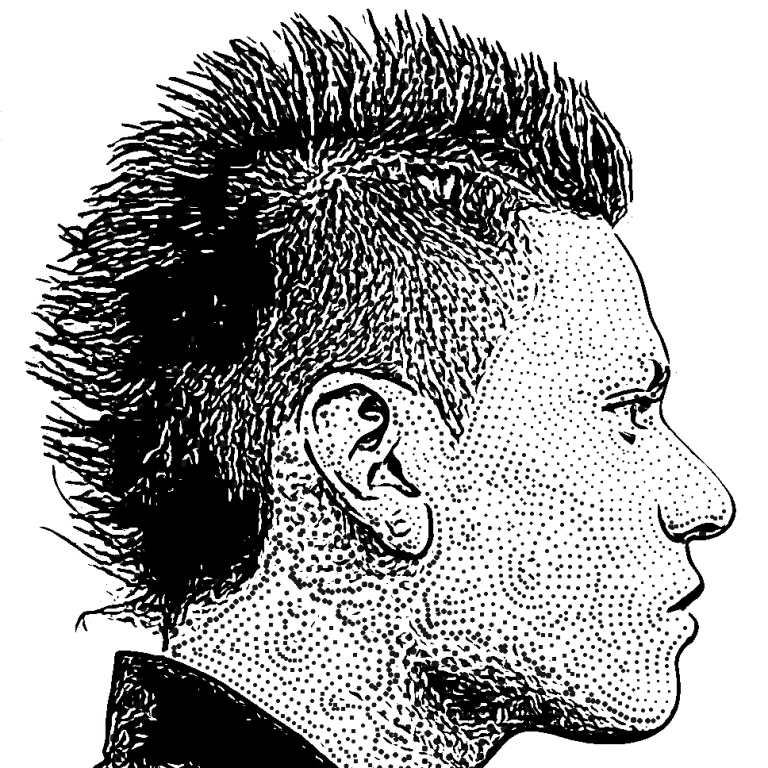
Adaptation of an image processing algorithm for mobile phones. Feature-guided stippling was implemented with centroidal voronoi tesselation.
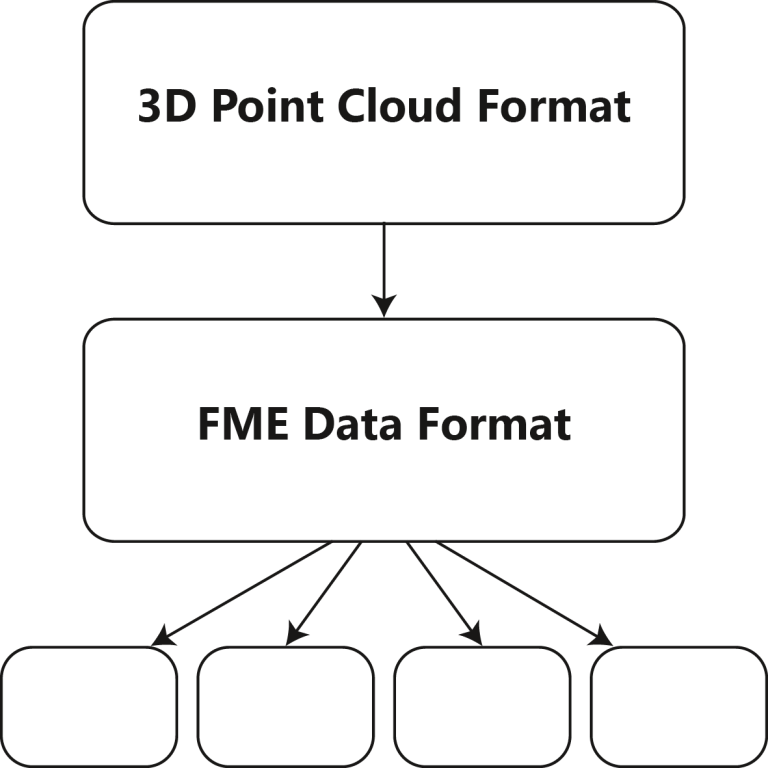
Integration of a 3D point cloud data format into the Feature Manipulation Engine which provides geo-data conversion.
Development of an out-of-core data format for huge 3D point clouds as well as processing procedures and tools for the interpretation of such point clouds.
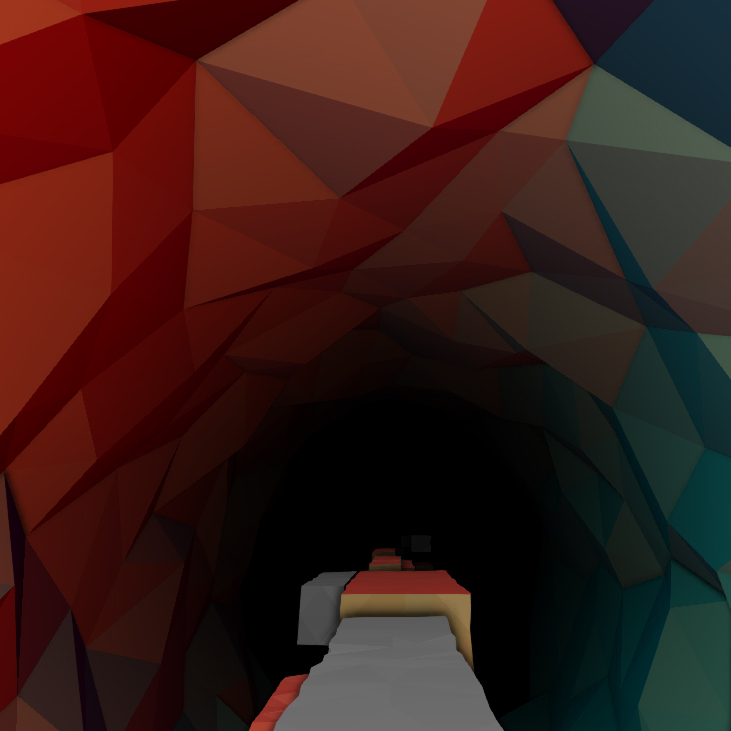
A high-speed gravity racer game including physics-based gravity, gravity switches and procedural level generation.

The friends concert design was in contrast to previous emotional designs based on the guest’s traits. A clear colour scheme completed characteristic photographies.
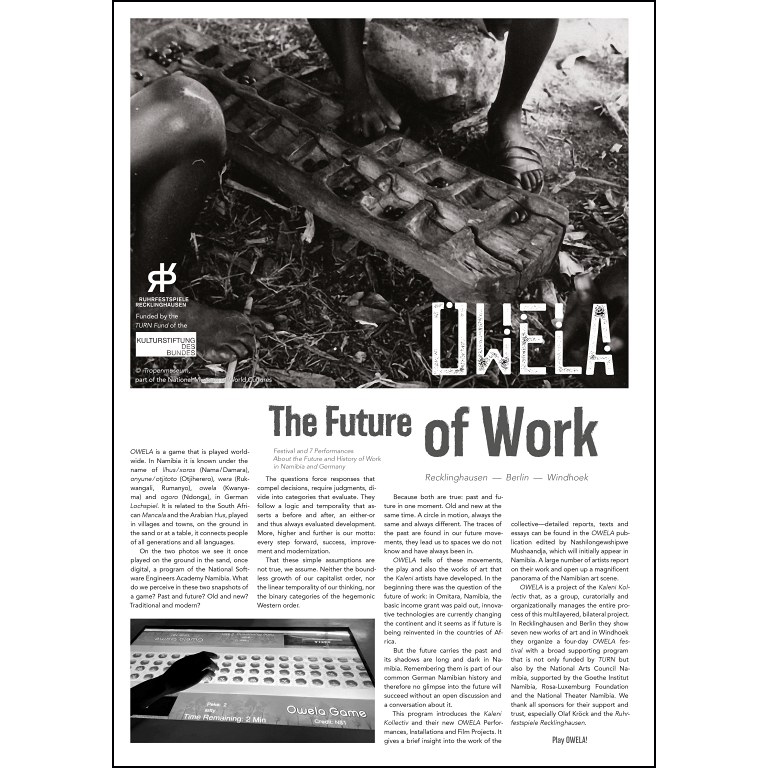
The accompanying newspaper for the OWELA—The Future of Work festival by the German-Namibian Kaleni Kollectiv was a moderate co-design of the Namibian festival newspaper.
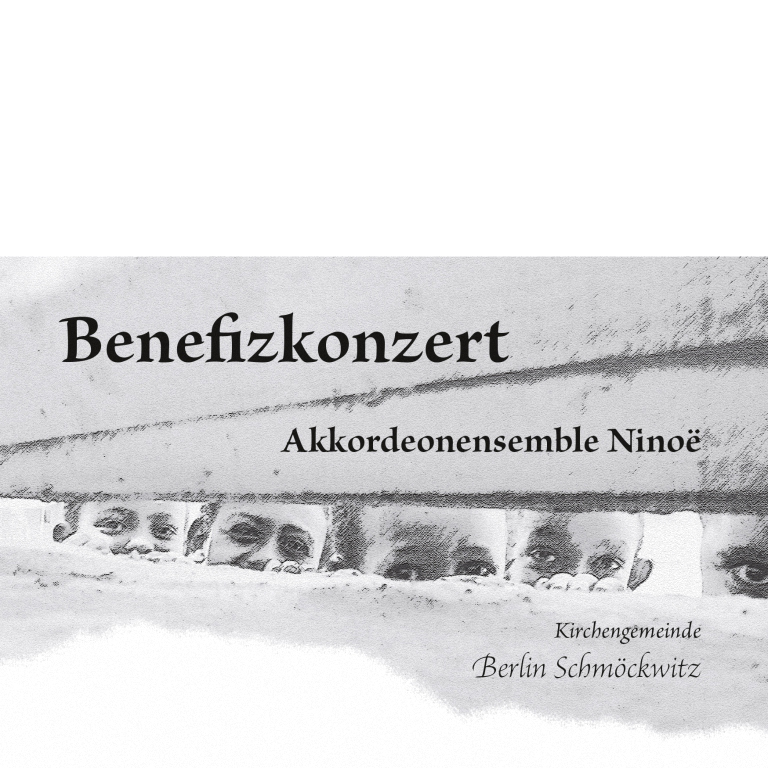
The design and production of this project had to be fast, simple and cheap. The one-paged Program was printed on environmentally friendly, recycled paper.
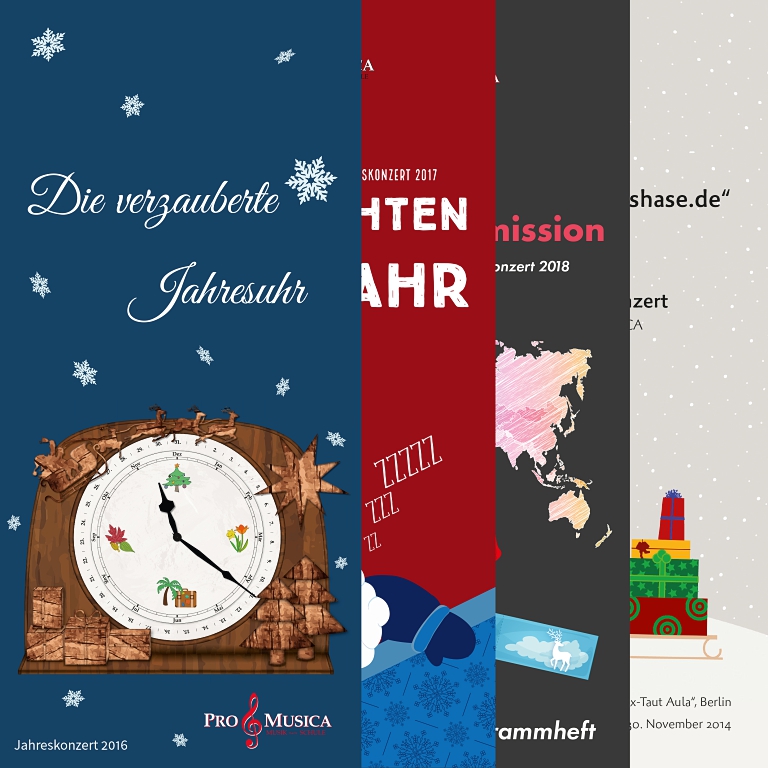
Since 2014, I regularly design Program and slide deck for the annual concerts of ProMusica. The main target group includes very young accordionists and their parents.

The third concert had a wintry but also festive and cozy atmosphere. The concert reflected a journey from stressful daily routine to Christmas. The highlight was an extensive Program.

The design of the new CD was based on the »Accordion meets Folk« theme. The design was expected to be not too conventionell and light weight.
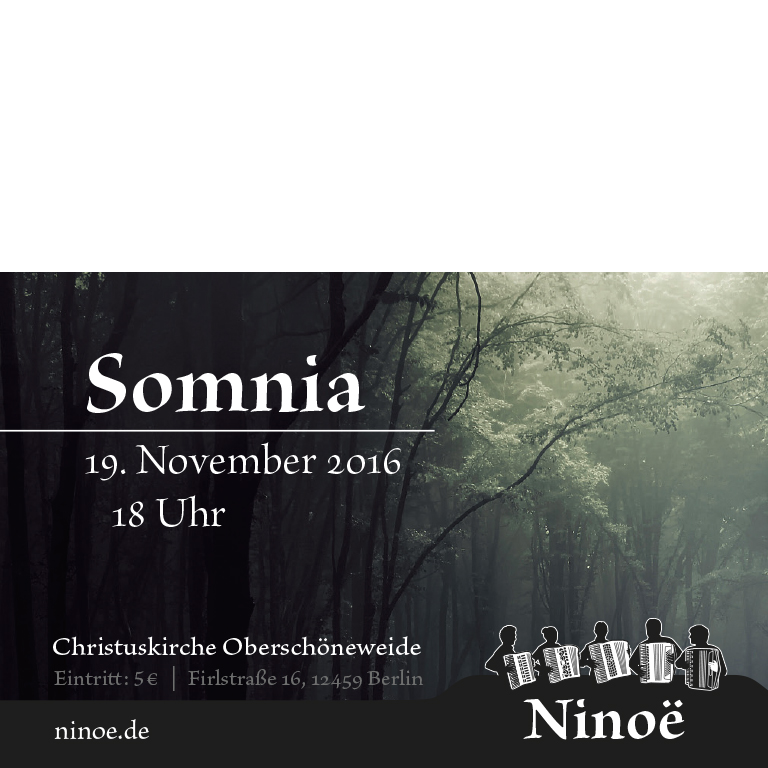
The second concert »Somnia« had an autumnal and gloomy atmosphere. The design reflected this utilising a forest photography with a low saturation and a single hightlighting colour.

Over the years, I designed noticeable decoration – such as a roll-up display and flags for sheet music stands – to gain more publicity for ProMusica. The design was exptected to be straight using the association's colours.
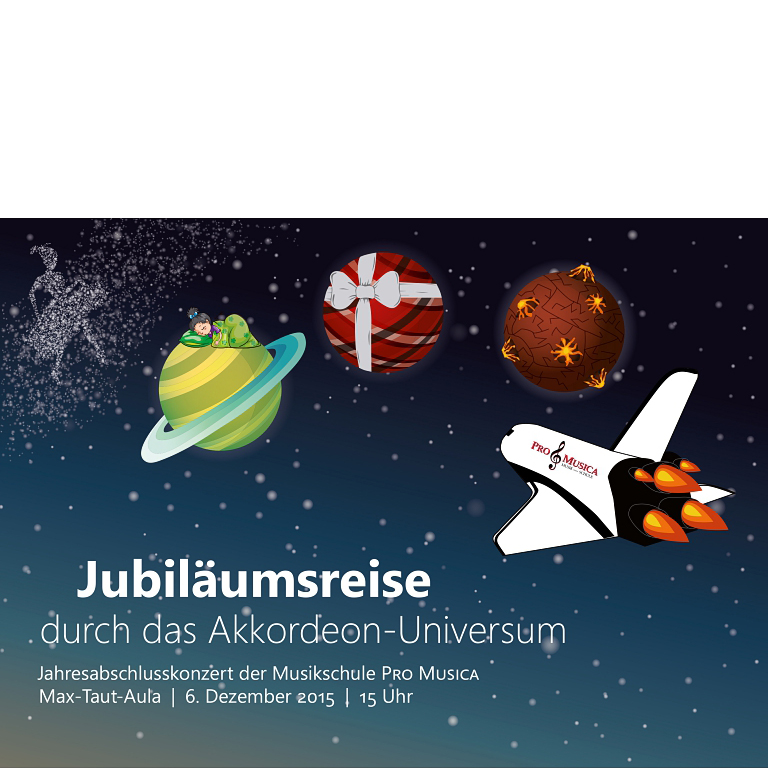
For the 20 year jubilee of ProMusica, the design of the annual concert should be extraordinary. Main theme was the journey through space to other musical planets. The project included complex and elaborate design elements.

The lead design of the first concert was expected to be simple and based on the website design. I chose a dramatic black and white contrast in a simple but expressive motif.
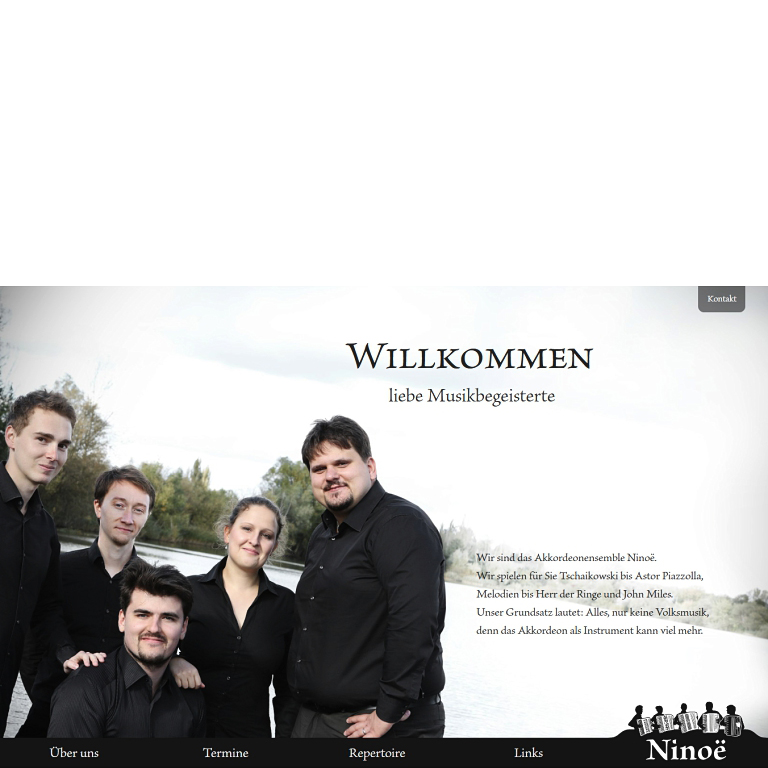
Starting with multiple design sketches, I designed and implemented the website of the accordion ensemble Ninoë. The main theme is a full-size photography style combined with fine typography.

The prominent differences and the uniqueness of the ensemble's members and their respective instruments were the characterising design elements for this logo design.